Have questions about a stock or etf?

If you have questions about the technicals of any stock or ETF
simply leave a comment with your question on one of my daily posts or tweet me your question @DeadAgain803 and I will
analyze it for you.

Thursday, September 22, 2011

I will be back eventually

                I am sorry I have been away; I have been dealing with issues ranging from a sick dog to frustration with the market.  I have enrolled in the “CNBC million dollar portfolio challenge” and as such have been overly distracted with fake money, real money, and my dog’s health issues.  All that aside, I wanted to let all 2 of my regular viewers that I will continue to cover market action when I have eliminated one, or more, of these issues from the equation.
                In the meantime, I wanted to share a video with you that was brought to my attention a little while ago.  For some the way in which it is presented probably won’t appeal to you, but the content is incredibly insightful.  This video really gets to the heart of the debate in Washington.  Have a look and pay attention more to the content than the presentation.

<iframe width="560" height="315" src="https://www.youtube.com/embed/d0nERTFo-Sk?rel=0" frameborder="0" allowfullscreen></iframe>

Wednesday, September 14, 2011

Analysis for 09-14-11

Intraday:
                What can I really say about this?  We started the day off with things looking like they were going to stop at the 20 day moving average and form a reversal pattern but things went nuts and just kept on rising bring us up to a close 1.35% higher.  None of this makes any sense and I’ll tell you why.  We had worse than expected economic data, a looming default of a country, A COUNTRY, and even more concerns in Europe.  This rally was not a sign of strength nor was it institutional investors.  It was individual investors who don’t know jack about the market.  None of our technical levels held up and the overall economic outlook has not changed.  If you want more evidence that this was individuals, just consider that the Scottrade servers crashed as the moves began to accelerate.

                Even with all of the above information, we can still see some things that point the market lower.  As we “rallied” today we ended up forming an even larger and broader bearish rising wedge with a sharp reversal with no warning in the last hour of trading.  This has given us a better shorting opportunity as we will probably see bears come into the market and slap this individual rally down and down hard not to mention all of the people who made money today will probably go ahead and take some profits.
Daily:
                On the daily time frame we set up a rather large spinning top pattern which can act either as a continuation or a reversal pattern.  All of our indicators are showing bullish signals but considering the nature of this rally and the lack of volume to confirm reversal I think this is going to fail.  Don’t forget that our indicators are based off of either moving averages or price or both and that irrational movements in the market can move them.

This irrational rally came up and reversed off of the upper trend line of this large bear channel which also kept us in our bear flag pattern.  If we break out of this bear channel all bets are off and we will be rallying much further to the upside.  Is this likely to happen?  I wish I knew for sure.  I think, however, that we are more likely to get a reversal tomorrow and begin a move to the lower trend line of our bear channel which will have made our bear flag pattern break down as well.  This rally has no strength behind it.  There was no real volume behind it, and there were no “big” moves in our indicators.  I expect to reverse down and hard.   

Tuesday, September 13, 2011

Analysis for 09-13-11

Intraday:
                Today we pretty much continued the trend from the end of the day yesterday.  We had a bearish rising wedge (red lines) that broke down 45 minutes after the open and settled into what might be a bull channel (orange lines).  We traded within this range throughout the course of trading.  This may be setting up as a much larger bear wedge which would put us in line with my theories thus far.

Daily:
                On the daily timeframe we got what amounts to a continuation pattern as far as candles are concerned.  We are getting mixed signals on our indicators which leaves us with an air of uncertainty.  The ADX has turned bearish, the MACD histogram is still bearish whereas the signal lines are turning bullish, and the stochastic is still bearish.  I wish I had a crystal ball and could tell you exactly what was going to happen but I can’t.  The best I can do is to outline the different possibilities. 

                From here we have a couple of possibilities.  We could reverse tomorrow as we have tagged the 10 day ema twice today but as we have formed a continuation candle that is somewhat unlikely.  We could continue up until we tag the 20 day ema and form a reversal pattern there.  Or we could move up to the blue trend line from the peak before the previous selloff, maybe at the 50 day ema.  All three of these things are possible but the overall move should put us back through the lower trend line of our bear flag pattern for a second leg down as we have confirmed a lower high and a lower low.  Look for another lower high to set up here sometime soon.
                 

Monday, September 12, 2011

Analysis for 09-12-11

Intraday:
                We started off the day by broadening the bear channel from yesterday led lower by, what else, European concerns.  We continued in this bear channel for most of the day until news that Italy has approached a Chinese mutual fund for assistance, not the Chinese government but a mutual fund.  Regardless of whether this goes through, ultimately the quantities talked about will ultimately have no effect on the issues in that region.  We continue to see the irrational trading strategy of “buy the news and sell the facts”.

Daily:
                Today, we ultimately failed to get the break of our bear flag pattern today with a potential reversal in the form of a hammer candlestick.  Having confirmed a lower high and a potential lower low that could complete sub wave 1 of my wave 3 we can expect to see a short lived rally.  This short rally will likely go up to either the 10 or the 20 day EMA (exponential moving average) before confirming another lower high and reversing to begin sub wave 3 of wave 3.  This is not to say that we could fail to get this rally considering that all of our indicators are still showing bearish signals and that we closed at a Fibonacci retracement level.

Friday, September 9, 2011

Play by Play Friday for 09-09-11

Intraday:
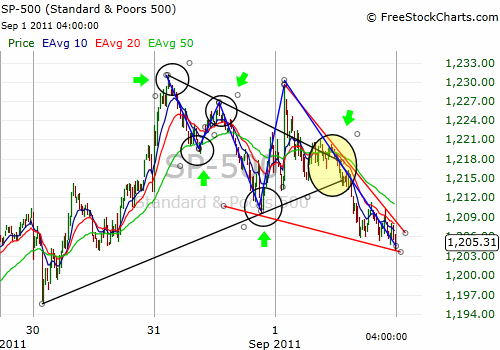
                We started the day with a sharp selloff following Europe’s lead down again.  Yesterday we were on the verge of forming a bearish alignment of the moving averages and with today’s price movement we got it.  We were in an orderly bear channel for the majority of yesterday’s session and probably would have continued in that formation had Europe not fallen so sharply as we broke down out of this pattern right at the open. 
                After the break down of yesterday’s bear channel we began setting up a bullish falling wedge.  We followed this pattern and broke out right around the European close.  After breaking out, and I mean immediately, we slammed into overhead resistance at the 10 period MA (the blue line).  Having hit resistance we then proceeded to back test the upper line of the pattern and gradually drifted lower.

                Following the failed break out of our falling wedge pattern we were forced to redraw our trend lines.  After redrawing trend lines we found a new bullish falling wedge.  In this new falling wedge we had a much tighter price range moving into the break out of this one.  This new wedge also failed as our moving averages had formed heavy overhead resistance which we could not surpass for most of the day.
                In the last hour of trading we saw another attempt to break out of this downtrend.  Over the last half hour we poked above the 10 period MA and made a quick attempt for the 20 (the red line).  After hitting the 20 period MA we reversed sharply and retreated back down to the 10 period.
Daily:
                On the daily time frame we two out of three indicators are Bearish.  The MACD is weakly holding on to bullish signals but moved into a position that makes bearish signals not only a possibility but almost certain.  The ADX and stochastic are continuing their bearish alignment and have not shown any signs of reversing yet.
                Having gone over the indicators in a general sense I want to tell you about divergences.  We have set up and are exhibiting divergences on both the MACD histogram and the stochastic (indicated by the black lines within the circles on the indicators.  This usually occurs when overall momentum is contrary to the price. 
There are several types of divergences but I won’t bother confusing you and I will keep it simple by using the words divergence and convergence to describe the patterns.  When in an uptrend, i.e. prices are moving upwards, and your indicator moves in a contrarian direction you have a divergence and prices tend to eventually move in the direction of the indicator (this is what I have pointed out on the chart).  This occurs in both uptrends and down trends and can be recognized by the “divergence” of price and indicator.  On the other side, that is the other type, we have what I call a convergence.  A convergence occurs when price and indicator, what else, converges.  This second form usually is an indication of a top or a bottom as it indicates strength at a turning point and can occur in uptrends or downtrends as well.

Our bear flag is setting up beautifully.  Paired with our indicators either being in a bearish alignment, setting up a divergence, or both we can reasonably expect to break down out of this pattern and move to challenge the 1100 level and quite possibly lower.  When you consider the above information and recognize that we got confirmation of yesterday’s reversal pattern and that downside volume is beginning to pick up you have to conclude that the best guess (that’s all that market analysis is) would be further downside movement.
All of the above information is culminating with my wave counts to play out.  According to my wave count we completed a wave 1 with the 1100 low and have just finished the sub wave 5 (the red zig zagging lines) of my wave 2.  If my wave count is indeed correct, we are looking at a large wave 3 down with another rally attempt for a wave 4, possibly with another bearish formation (i.e. a rising wedge, or even another bear flag) before making one final push lower to form a wave 5 before moving back into a bull market.  This could all fall apart if Bernanke comes out with some form of QE or if there is some extremely good news either about jobs or out of Europe.
Weekly:
                On a weekly time frame, 2 out of three of our indicators are in agreement.  The ADX and Stochastic are in a bearish alignment but the MACD histogram is holding on to a series of upticks.  Even though the MACD is showing mixed signals (i.e. histogram up but signal lines down) we have several signals that we are headed lower next week. 

                With potential bearish signals on all three indicators paired with confirmation of a reversal pattern off of our last up week, we can be confident that the markets are heading lower.  We will likely pause temporarily at several possible levels of support(these levels are indicated on the chart by the red horizontal lines and will provide insight to the end of this bear market and potential reversal points to put us in a new bull market).  These levels of support are, however unfortunately, levels that we haven’t seen since last year.  Further beyond these levels we have no support until the 666 bottom from the ’08-’09 break down. 

Obama Vs. Congress

  
                Obama came out swinging with a 1, 2 to the face followed up by a hard shot to the body.  Last night we heard from President Obama on his jobs bill entitled “The American Job Act”.  By his description during the speech it sounds like this is an extremely bipartisan and all-encompassing bill.  He roughly outlined programs that both parties want and don’t want.  Over all, I think that this is the best course of action.  This bill will give compromise on both sides and help get us out of this mess.

Thursday, September 8, 2011

Analysis for 09-08-11

Intraday:
                Today we started off relatively stable continuing the overall trend of the past three days.  We remained more or less flat following Europe’s lead once again.  We ended up breaking bearish rising wedge after bearish rising wedge forcing us to constantly redraw our lower trend lines (red trend lines).  As we approached Bernanke’s speech we appeared to find support at the upper boundary of the bull channel from three days ago.  Right as Bernanke began to speak we broke down out of the bearish rising wedge patterns and the upper boundary of Tuesday’s bull channel.  By the last hour of trading we moved all the way down to the lower trend line of the three day bull channel and ultimately broke through that as well.  The last 30 minutes of trading we back tested this line and immediately reversed off of it (the strongest trends don’t retest.  I have no info to support this but I hear it often from other analysts.).   

Daily:
                Today our indicators remain somewhat bullish despite the day’s sentiment over Bernanke’s speech.  The ADX is still in a bullish alignment, the MACD is trending sideways but remains bullish, and the stochastic looks as though it is turning bullish.  Even though we ended down for the day our indicators are moving into agreement but this can change if tomorrow’s price movement is also down.
If we look at just today’s price movement, we have formed a “spinning top” pattern (pretty self-explanatory).  This is typically a candle of indecision indicating an overall lack of direction.  By itself this pattern is more of a continuation pattern but does have the potential of reversal.

                We set up a potential reversal pattern in the form of a two day candle pattern called a bearish harami.  A harami forms when the day’s real body forms within the real body of the previous day (harami is Japanese for pregnant).  Directional connotation is usually on the second day’s price movement. Bullish is an up day after a down trend where bearish is a down day after an uptrend. 
From here we still have pretty much the same possibilities as we did yesterday (see yesterday’s post).  We could continue down and break our bear flag or we could move up a bit more before we reverse.  I am still thinking that we will see further upside to somewhere in between 1225-1240 considering that our indicators are showing bullish signals.   

Wednesday, September 7, 2011

Analysis for 09-07-11

Intraday:
                Well, we continued yesterday’s rally after the initial selloff and are continuing to follow Europe’s lead.  We had a large rally at the open and steadily moved higher throughout the day.  We appear to be setting up two possible bearish rising wedge patterns.  The wedge with the blue lower trend line will likely breakdown sometime tomorrow. We could find some support at the upper trend line (the green line) off of yesterday’s bull channel. I expect, however, that the larger pattern will hold more firmly up until we either form another reversal pattern on the daily time frame or hit the upper trend line of our bear flag pattern.

Daily:
                I have a lot to go over on the daily time frame, so bear with me.  Our usual indicators are giving mixed signals once again.  The ADX has moved to a bullish alignment, the MACD and histogram are in agreement and appear bullish at the moment, but the stochastic is still in a bearish alignment.  I expect that our indicators will all move into agreement on the next up day which we should get tomorrow.
                The blue lines on the chart depict a large bear channel which could prove very difficult to get out of.  Any break of this trend line should be watched extremely carefully as it could be a shake out of more risk averse investors.  We could also continue to trade within this channel for an extended period of time because trend lines get drawn, redrawn, extended, contracted, and expanded frequently. All of these things happen especially when volatility is high, as it is now.
                Today we got confirmation of yesterday’s hammer reversal pattern as well as a new bullish pattern.  This new bullish pattern is called a bullish engulfing pattern (the green circle on the chart).  Engulfing patterns occurs when the day’s price movement completely “engulfs” or overshadows the previous day’s candle.  This usually occurs with a gap in the direction of the previous trend.  You could make the case that this is a “matching low” pattern (these two patterns only consider the real body of the candlestick) either way, they are both bullish patterns.  I usually consider matching low patterns as a pattern of its own but when you have a clear engulfing I will call it a combination and consider it a stronger signal.  At this moment I see no signs of impending reversals off of yesterday and today’s trend so I expect us to continue higher.
                We continue to trade in this bear flag pattern (the red rising trend lines) and the longer we do so, the more confident I get that my current analysis is correct. When combined with my current wave counts (black zig sagging trend lines and red falling parallel trend lines) we can project what may happen over the next week or so (see older posts for further explanation).  We appear to have completed sub wave 4 and have begun sub wave 5 of my overall wave 2, remember that Eliot wave says that each market movement occurs in 5 waves.  Wave 2, of 5 large waves to complete this down trend!
                If our current direction continues over the short term, we can reasonably expect one of three things to happen.  One, we could reverse off of today’s bullish signals and daily patterns to thrust us lower (the first red falling trend line).  This is very unlikely at this point but with recent market moves it is a possibility.  Two, we could move up again tomorrow and form a reversal pattern around the Fibonacci level at the 1205 level (the middle red falling trend line).  This could play out putting in the first lower high indicating an overall change in direction and send us lower possibly to challenge the ’08 lows.  Three, we could move all the way up to the upper trend line of our bear flag pattern and slam into three converging resistance levels.  These resistance levels alone could easily stop an upward movement but combined they are a steal door.  This convergence of resistance levels consist of; 1, the upper trend line of our bear flag pattern, 2, the upper trend line of our bear channel, and 3, a Fibonacci level at 1235.  I believe that this final scenario is the most likely to occur.  Watch these levels and possibilities carefully and trade with caution.


Tuesday, September 6, 2011

Analysis for 09-06-11

Intraday:
                After an initial selloff on European worries which made the bear channel we formed on Friday break down, we began setting up a bearish rising wedge pattern.  That pattern broke down late in the day and moved to form a bull channel.  Right at the end of the day we ended up getting a bullish alignment of the moving averages.  The patterns we formed today, on an intraday basis anyway, suggest that we are going to head higher.

Daily:
                On the daily timeframe today’s price movement brought us to a low which tagged the bottom trend line of our bear flag pattern before reversing and spending the rest of the day slowly moving back up.  We ended setting up a potential reversal pattern in the all too common hammer.  For confirmation of this reversal pattern we will be looking for a closing price above today’s high as all reversal patterns require confirmation. 

Our bear flag pattern continues to play out and we speculate that we will go higher.  Considering that today we tagged the lower trend line of our bear flag pattern and appear to be forming a reversal pattern off of that.  We could begin our final sub wave of my wave two before ultimately heading lower to break down out of this pattern.  
                With the above information under consideration we must also look to our indicators.  Our indicators, at the moment, are still showing bearish signals.  The ADX is still broadening, the stochastic is still pointing down, and the MACD histogram put in another downtick with the signal lines turning down.  All this considered, I suggest being very careful as long as we remain in this bear flag pattern and would not make a play until we have a decisive break in one direction or another.

Friday, September 2, 2011

Play by Play Friday for 09-02-11

Intraday:
                We started off the day with a historically bad jobs report which pushed us down from about 1204 to 1176 (1).  We then began trending sideways trading between 1176 and 1186 up to the European close (2).  From about 10:00 we began setting up a triangle pattern which broke down nearly right after the European close (3).  Over all, we traded within a slightly downward trending channel for the whole day.  If we take the price action from yesterday’s close into account we can draw a potential bullish falling wedge.

Daily:
                On the daily time frame our indicators have all moved into agreement.  The ADX is back in a bearish alignment the MACD histogram has put in a down tick with the signal lines beginning to turn, and the stochastic remains bearish after yesterday’s turn.  Volume on the day was again pretty much average indicating that we are still in the formation of a pattern.

                We continue to set up our bearish flag pattern for the moment.  We have put in a continuation pattern in the form of a large negative candlestick.  The bad jobs data that came in before the close pushed us through the first gap support level and sent us down toward the second.  Our overall price movement put us just below the second gap support level and right around the 23.6 Fibonacci retracement level. 
We could reverse from here if something good happens over the weekend but I think we will probably continue down to the bottom trend line of our flag pattern to finish off our sub wave 4 of my wave 2 as we got the formation of a continuation pattern today.  I expect that we will get one more rally attempt at some point.  Where we will rally to for sub wave 5?  I am not sure we have multiple levels of resistance within this bear flag and we could reverse off of any of them.
Weekly:
                We are getting some major contrarian signals from our indicators on the weekly time frame most likely because the ADX and MACD have components that lag the price movements.  I will try to find better indicators for this time frame.  The ADX is in a bullish alignment and has been for the entire down trend to this point.  The MACD histogram put in an uptick but the signal lines remain bearish.  We are getting our best weekly signals on the stochastic as it has crossed at nearly every top and bottom. 

 (Please pardon the typo on the weekly chart.  I wrote bullish engulfing whereas it is a bullish harami)            
               We put in what is called a gravestone doji (a very bearish signal).  The formation of this candle pattern represents a failure to rally (“candlestick charting explained” Gregory L. Morris).  Having a wide range of motion in price and closing near the lows for the week it is much easier to clear the low of this pattern than the high (ever heard “the path of least resistance”?).  Given all the information that I have put forward today and the work I have done during the week, I expect us to close down next week.  This may form out of a failure to rally more than half way through the bear flag pattern, or we could finish off our sub wave count and begin my wave 3 down which could move us to challenge the 2009 lows.

Thursday, September 1, 2011

Analysis for 09-01-11

Intraday:
                Early in the morning we tried to break out of the wedging pattern that I pointed out yesterday (the black lines) on a mixed ISM number at 10:00.  We immediately back tested the upper trend line of the pattern before continuing down in a whip saw fashion with consistently lower lows and lower highs (clear circles).  Towards the end of the trading session we began to set up a bullish falling wedge (the red lines).  When you pair the bullish falling wedge with the potential wave count (the blue lines) you can reasonably expect an attempt to rally early in the morning. 

Even though we have potential for an early morning rally, I advise extreme caution.  We can also see that before setting up this bullish falling wedge pattern we got a bearish alignment of the 10, 20,and 50 period moving averages (the yellow circle).  Also keep in mind the daily analysis below.
Daily:
                On the daily time frame we can see that our indicators are beginning to show bearish signals.  This is most evident with the stochastic as we just got a cross of the lines.  The Di lines on the ADX are beginning to diverge again.  The MACD histogram however is showing some mixed signals.  The histogram is flattening out but the signal lines are still bullish.  I expect the histogram will turn and then the lines will follow suite.
                It looks like the bearish flag pattern I have talked about frequently as of late is becoming eerily accurate.  We slammed into overhead resistance at the 50 day EMA and 50% fib (Fibonacci) retracement level all at the upper trend line.  Having formed a reversal candlestick pattern yesterday with a confirmation today off of that resistance, I think that we will continue the reversal.  Most likely we will either move back down to the gap we formed three days ago or we could continue all the way down to the lower trend line of our bear flag pattern. 

                After this next move down, if my wave count is correct (Eliot wave is very speculative and should be traded with caution), we can expect one final rally attempt.  This rally attempt may fail at the gap resistance/support level I talked about above, or we could go all the way back to the top of the flag pattern trend line.  If this continues to play out the way I think it will we can expect this push down to complete sub wave 4 and the subsequent rally attempt to complete sub wave five to finish of my wave 2.  If I am right about this we are still looking at another major drop in the markets.