I can no longer keep my mouth shut! I have heard too many people saying that Bank of America and other financial stocks and ETFs are cheap at this level including friends and family. I really hope that those who read this blog take this as a warning of things to come and take action to avoid massive losses.
Stocks are cyclical, that is they move in cycles. These cycles are usually very reliable. One of the things that the current part of the cycle we are in is showing is the bear side of the cycle. In the bear side of a market cycle several things happen. First the leading sectors of the previous trend top and drop. We have already begun to see this with oil and tech stocks topping out and dropping significantly in price.

Second, money begins to move to sectors that have been historically safe. These sectors change very little over time. In order from least safe to safest, these safe sectors are consumer staples, utility stocks, commodities, and cash. We are just beginning to see this move as these sectors or segments of the market are currently outperforming the market.
Third, when the market begins to find a bottom, one of the first sectors to rebound is financials. This is most likely due to an increased desire to save within the private sector hence an increase in the earnings for this sector in the next reporting cycle after the bottom. We have not even begun to see any measure of strength coming out of this sector.
Below are charts for Citi group, Bank of America, JP Morgan, and XLF the S&P select spider etf for the financial sector. All of these charts are exhibiting the same pattern. This pattern is called a bear pennant. A bear pennant occurs when the market trades within a downward channel and begins to make an attempt to rally. This rally ultimately fails due to the inability of the price to make it through an overhead resistance level that has been tested and retested over and over again with smaller and smaller price movements. After the final attempt this pattern breaks down indicating a much larger drop than the previous downward trend. On every one of these charts we see the same pattern which broke down two trading days ago and has begun a further move down.


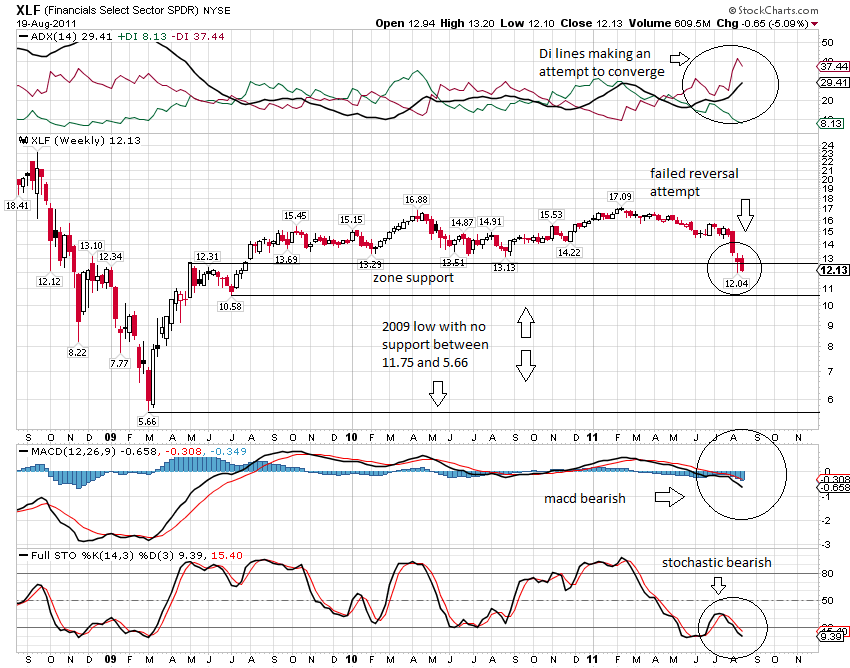
When we look at the chart for XLF on a weekly time frame we can see that we are currently trading within a “support zone” formed this time of year two years ago. If we make it through the lower support level of this zone, we are more than likely going all the way back to the ’09 lows. The below annotated chart is showing multiple signals that make me think this is going to be what happens. Although the Di lines on the ADX are showing an attempt to converge, we are seeing a candlestick reversal pattern that failed to confirm, a bearish MACD, and a bearish stochastic alignment.
Do yourself a favor. Do not buy into any financial market yet. Wait for clear reversal signals and returned strength in the market. I hope I have been helpful and will save you some money. What’s the worst that can happen if I’m wrong? If I’m wrong you have lost nothing.
No comments:
Post a Comment