Intraday:
Early in the morning we tried to break out of the wedging pattern that I pointed out yesterday (the black lines) on a mixed ISM number at 10:00. We immediately back tested the upper trend line of the pattern before continuing down in a whip saw fashion with consistently lower lows and lower highs (clear circles). Towards the end of the trading session we began to set up a bullish falling wedge (the red lines). When you pair the bullish falling wedge with the potential wave count (the blue lines) you can reasonably expect an attempt to rally early in the morning.
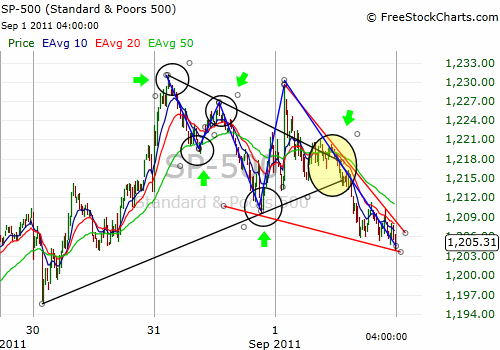
Even though we have potential for an early morning rally, I advise extreme caution. We can also see that before setting up this bullish falling wedge pattern we got a bearish alignment of the 10, 20,and 50 period moving averages (the yellow circle). Also keep in mind the daily analysis below.
Daily:
On the daily time frame we can see that our indicators are beginning to show bearish signals. This is most evident with the stochastic as we just got a cross of the lines. The Di lines on the ADX are beginning to diverge again. The MACD histogram however is showing some mixed signals. The histogram is flattening out but the signal lines are still bullish. I expect the histogram will turn and then the lines will follow suite.
It looks like the bearish flag pattern I have talked about frequently as of late is becoming eerily accurate. We slammed into overhead resistance at the 50 day EMA and 50% fib (Fibonacci) retracement level all at the upper trend line. Having formed a reversal candlestick pattern yesterday with a confirmation today off of that resistance, I think that we will continue the reversal. Most likely we will either move back down to the gap we formed three days ago or we could continue all the way down to the lower trend line of our bear flag pattern.

After this next move down, if my wave count is correct (Eliot wave is very speculative and should be traded with caution), we can expect one final rally attempt. This rally attempt may fail at the gap resistance/support level I talked about above, or we could go all the way back to the top of the flag pattern trend line. If this continues to play out the way I think it will we can expect this push down to complete sub wave 4 and the subsequent rally attempt to complete sub wave five to finish of my wave 2. If I am right about this we are still looking at another major drop in the markets.
No comments:
Post a Comment