Have questions about a stock or etf?

If you have questions about the technicals of any stock or ETF
simply leave a comment with your question on one of my daily posts or tweet me your question @DeadAgain803 and I will
analyze it for you.

Wednesday, August 31, 2011

Analysis for 08-31-11

Intraday:
                We started off the day with a nice little rally as people came in trying to “game” the FED betting that the Fed would come out with QE3.  Although this seems to be their economic ammo I don’t think that we will be seeing QE3 as Bernanke clearly put the ball in Washington’s court.  If Washington ends up dropping the ball, which we can almost expect at this point, then we will see some form of QE (quantitative easing/printing money) sometime in late September. 
                After the speculation on the FED, we began moving down after the department of justice announced that it was blocking the AT&T/T-mobile deal.  Why this moved the market so broadly I have no idea.  The recent moves could be evidence that there are not many institutional investors in the market and the individuals are moving them.

                Altogether we ended up with a wedging pattern that has been forming over the past two days.  The upper and lower trend lines are still rather far apart so we could still see some movement within them.  This pattern doesn’t have any specific connotation (bullish/bearish) so I can’t say for sure which way it will break.
Daily:
                On a daily time frame our indicators are still showing bullish signals but I don’t think it will last much longer.  Today we formed an inverted hammer but if we combine today and yesterday’s candles (remember the additive property of candles?) we get what is called a spinning top.  Spinning top candlesticks are candles of indecision.  This combined with overhead resistance at the 50 day EMA (exponential moving average) and the 50% Fibonacci retracement level (Fibonacci retracements are numbers based off of the Fibonacci ratios based on the numeric sequence bearing the same name i.e. 0,1,1,2,3,5……).

                From hear we may continue if we can clear these overhead resistance levels to continue the double bottom pattern that I laid out and move to the 38.2 retracement level (which just happens to be our neck line) or continue up to the 23.6 level (this just happens to be where our 200 day EMA is at the moment. If we reverse from hear we can expect to retrace back to the 61.8 or 78.6 Fibonacci levels to form sub wave 4 of my wave count before moving back up for a sub wave 5 to complete my wave 2 and then go down to challenge the 1100 level. 

Tuesday, August 30, 2011

Analysis for 08-30-11

Intraday:
                We started the day off with a little bit of the sell the rally crowd coming in at the open.  We then got a terrible consumer confidence number which pushed us to the lows of the day.  After that we began something of a whip saw day as we meandered higher before running into overhead resistance from nearly a year ago at the 1220 level.  Ultimately we set up a bearish rising wedge by the end of the day.

Daily:
                On a daily time frame we ended setting up a potential reversal candle in the form of a doji.  This particular doji does have a bullish connotation considering that we closed slightly up in the upper half of the trading range.  This is getting very tricky, considering we have a potential reversal pattern with the majority of our indicators flashing bullish.  The one thing we haven’t seen yet is the 10 day crossing above the 20 day moving average.

This could end up being a continuation making my double bottom play out.  The bear pennant failed to play out as we closed above the previous peak.  Although the double bottom has some potential, I think it is more likely that we will continue setting up this rather large bear flag.  Before breaking down for a move through the 1100 level.  We will likely pull back to the gap from yesterday as a sub-wave 4 of my projected wave 2.  After that we can expect to rally back to the upper trend line of the flag pattern to finish off a sub-wave 5 marking the beginning of my wave 3 down.

Monday, August 29, 2011

Analysis for 08-29-11

Intraday:
                Today we got a “thank god the hurricane wasn’t as bad as we thought” rally.  After the initial jump we slowly drifted higher following a rather narrow channel taking us from lows of 1294 to a high of 1210.  This 1210 level is an area of resistance we should watch very carefully, there are several things that can happen from here.

Daily:
                The Di lines are moving closer together suggesting a bullish alignment but with the ADX still higher and turning downward we may see them bounce off each other.  Although the MACD is in a bullish alignment it remains in oversold territory.  And the stochastic is approaching overbought levels.  Having hit overhead resistance at 1210 with mixed signals I still remain bearish.  I believe that we will continue to see the formation of this pennant pattern or may advance a little more to form a bear flag.  I believe the former is more likely than the later. 

                Having hit overhead resistance we now look to gap support/resistance.  Often when there is a gap in price movements, that gap then becomes a support/resistance level when prices switch directions.  We have seen two of these recently, one today (G2) and one about a week and a half ago (G1).  Having hit this resistance level at 1210 we could push higher like I laid out last week when I talked about the double bottom swing trade bottoming pattern.  Or we could reverse off of the 1210 area and continue to form the pennant pattern before breaking down like I posted at the end of last week and above.  Or we could form a bear flag like I talked about above.  I wish I could give you a better idea of where this is going but right now there are no clear signals to know for sure.


Saturday, August 27, 2011

Play by Play Friday 08-26-11

Intraday:
                If my wave counts are right, we topped out on the buffet bounce from Wednesday to complete a wave 5 of sub wave 1 (sw1) on a 15 minute time frame.  Thursday we put in 5 more waves to complete sub wave 2 (sw2) putting us in a position to advance on Friday.  Friday was a little complicated due to GDP numbers which were contrary to market moves and were actually a bad number and came in lower than expected.  We then heard from Ben Bernanke who pretty much reiterated what he said last time.  When in a down trend, if the Bernanke comes out and doesn’t see his shadow, there will be more down trend.  If he does see his shadow markets will turn (QE3).  All of this had no real effect on the market although markets were watching intently to see what he would do.  The market moves on Friday put in 2 waves of a sub wave 3 so far.

Daily:
                On a daily time frame we are still seeing bullish signals on the MACD and the stochastic but the ADX has begun to turn again.  The daily chart below has my preferred wave count.  The black lines are the primary waves, the red lines are the sub waves of primary wave 1, and the green lines are the sub waves of primary wave 2.  This may end up putting us past the 20 day and hitting the 50 day before reversing by the time we finish sub wave 5 of wave 2.  Or we may never completely clear the 20 day and end up forming a wedging pattern that would be the tail end of a bear pennant and catapult us down.  I am really sorry for switching between strategies and patterns but we have to be flexible when markets call for it.

Weekly:
                On the weekly time frame we are beginning to get bullish signals from the ADX and the stochastic but the MACD is still very bearish.  We appear to be setting up a bullish falling wedge but it could continue to fall for some time.  Although we did und up for the week, which I didn’t think was going to happen (refer to last week’s Play by Play), according to the additive property of candlesticks we put in a doji candle.  If you recall from previous posts, doji are candles of indecision.  Although this doji has a bullish connotation, we could continue to fall as all patterns require confirmation. 

For next week I think that we will have to defer to the daily chart and see where our swings take us.  If my counts are correct, we could end up down for the week.  I am sorry that I appear to be overly bearish but I am just pointing out my observations.  Watch the 1210 and the 20 day moving average on the daily chart for a turn up and the 1020/1010 level for a turn down.  Trade carefully and be safe.

Thursday, August 25, 2011

Analysis for 08-25-11

Intraday:
                After the Buffett bounce early in the morning we reversed when we hit the 20 day moving average on the daily chart.  There was no real pattern that I saw on the intraday chart other than the fact that we traded within almost the exact same range as we did yesterday.  This is indecision defined.  Everybody is waiting for jack hole (the Jackson Hole meeting) and getting ready for any announcement good or bad.

We saw something during trading today that isn’t usually as clear as what it was today.  With the Buffett bounce we saw money rush into financials only to reverse sharply shortly thereafter as we saw some short term profit taking.  That was not the unusual clearness I was talking about.  The unusual clearness is the combination of money leaving safety stocks as well as leaving risky stocks after the initial bounce.  Just about everyone is waiting for the fed announcement tomorrow.  You want a face ripper rally?  So do I, and if the markets like what they hear we will see one.  However, if Bernanke disappoints or we see a bad GDP number tomorrow we could see massive capitulation.
Daily:
                On a daily time frame, nothing really changed.  As I said before we settled into an indecisive pattern.  This indecisive pattern is called a “doji”.  We didn’t see a doji set up as a single day candle but when you combine yesterday’s candle with today’s candle you get one.  Dojis are usually an indication of indecision but they can have a positive or negative connotation depending on where they occur within a trend and/or the position of the cross (higher being more bullish and lower meaning more bearish).  The positioning of this doji combined with the lower cross (called a shooting star doji.  Don’t let the positive connotation fool you, this is a bearish pattern) has a bearish connotation.

                We appear to be setting up a triangle/wedging pattern (a sign of consolidation before a move).  Tomorrow’s fed meeting and economic data could push us either way.  On the other hand, if tomorrow’s information and data has no real connotation either way, we could continue to consolidate until we hear from the president about his jobs program.  I personally will be sitting on my hands until the market chooses a direction by either breaking the current upper trend resistance or breaking below the 1120 level.

Analysis for 08-24-11

Intraday:
                Sorry I am late getting this in.  It looks like the scenario I laid out Tuesday and Wednesday morning is going to play out.  We started the day continuing the trend from Tuesday before turning down to put in rather large swings.  About half way through the day we finished setting up a bull flag and broke out.  After the break out we bounced back and forth between the 10 and 200 period moving average before moving higher and making new highs for the day. 

Daily:
                We put in another day of gains after getting our reversal confirmation Tuesday with price barely squeaking by the 10 day moving average.  All of our indicators are currently bullish.  We will be watching for prices to cross over the 20 day moving average as upside resistance and then we will be watching the 1210 area very closely.  If we fail to get above the 1210 level the wave count I laid out for you on Tuesday will have failed.  If we get above the 1210 level we will be looking to the neckline of our head and shoulder pattern, the 50 day moving average, and the 1300 level respectfully.  Keep in mind all of this is happening ahead of Jack Hole (Jackson Hole).  If one trick pony Ben says something the market doesn’t like, we could see a massive drop In the markets possibly to challenge 1100 bottom once again.

Wednesday, August 24, 2011

Addendum to yesterday’s analysis

Yesterday I began talking about swing trading and I forgot to mention something.  Swing trading relies on the basis of market swings making higher highs and higher lows or lower highs and lower lows.  What I forgot to mention was that there is a very clear bottoming pattern that pertains to swing trades.  This pattern emerges out of an existing downward channel and consists of the swings failing to put in a lower low.  We could still go further down or we could go up.  For confirmation of the swing we will be looking for a higher close than the previous peak which we put at the 1210 level.  As before, if this plays out we would be looking for five minute waves to form the second wave of the larger count.

Tuesday, August 23, 2011

Analysis for 08-23-11

Intraday:
                On the 30 minute chart for the S&P 500 we broke out above the downward trend line we had been following for the past week or so.  Shortly after the breakout we moved into a bullish alignment of the 10 and 20 period moving averages and set up a bull channel which we remained in the rest of the day.  All of this left us with a confirmation of Friday’s reversal candle pattern indicating a move higher.

Daily:
                This annotated chart gets a little messy because I wanted to start talking about Eliot wave theory.  From what I understand about Eliot wave is that markets move in waves up and waves down.  Some people call these moves swings.  Now, Eliot wave says that markets move in five waves and each wave can be subdivided into smaller waves.  In Eliot wave theory, waves move from top to bottom and vice versa.  
                The blue lines on my chart show the first three waves of the larger move down based on the apparent bear market and the recent lows.  The red lines are the first subdivision of the first wave down and the green lines are a projection of where the market may go from here to complete the second wave and begin the third down for our second leg down of the bear market. 

                Having received confirmation of our reversal today we also see some indication of bullish momentum entering the market.  The Di lines on the ADX indicator are converging again.  The MACD histogram appears to have put in a higher low.  And the stochastic is attempting to cross the signal line (the red line).  I am fairly confident that what I started saying about moving back to the neckline of our head and shoulder pattern is getting ready to play out. 
                               I should point out that no indicator or trading strategy is perfect and Eliot wave is no different.  Eliot wave usually breaks down if your wave count is wrong.  As with everything else you need confirmation.  This is why I usually don’t subscribe to this trading method but for things to be appearing to play out so well with my count at this point, I am going to use it. 

Monday, August 22, 2011

Analysis for 08-22-11

Intraday:             
We started the day off with about a 2% move upward before turning back down and ultimately closing lower for the day.  This is a classic single day pattern called a “gap and trap” which in itself has no real indication of future direction but does indicate weakness in the market.  In short, we have gotten nowhere from Friday.

Daily:
                On the daily chart we failed to get confirmation of our potential reversal pattern from Friday.  The Di lines on the ADX still looking like they want to converge.  The MACD and stochastic remain bearish.  I should point out that even though we are still in a bar channel we are beginning to set up a bullish falling wedge.  If we continue down we could see, at least, another 100 point drop on the S&P 500.  If we get confirmation of the reversal pattern from Friday, we will be looking for prices to advance to the 20 day moving average, maybe back to the neck line level of 1260.

Banks a bargain?

                I can no longer keep my mouth shut!  I have heard too many people saying that Bank of America and other financial stocks and ETFs are cheap at this level including friends and family.  I really hope that those who read this blog take this as a warning of things to come and take action to avoid massive losses. 
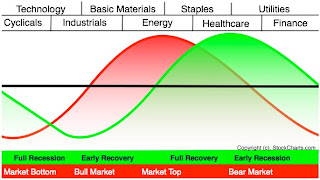
                Stocks are cyclical, that is they move in cycles.  These cycles are usually very reliable.  One of the things that the current part of the cycle we are in is showing is the bear side of the cycle.  In the bear side of a market cycle several things happen.  First the leading sectors of the previous trend top and drop.  We have already begun to see this with oil and tech stocks topping out and dropping significantly in price.

                Second, money begins to move to sectors that have been historically safe.  These sectors change very little over time.  In order from least safe to safest, these safe sectors are consumer staples, utility stocks, commodities, and cash.  We are just beginning to see this move as these sectors or segments of the market are currently outperforming the market.
                Third, when the market begins to find a bottom, one of the first sectors to rebound is financials.  This is most likely due to an increased desire to save within the private sector hence an increase in the earnings for this sector in the next reporting cycle after the bottom.  We have not even begun to see any measure of strength coming out of this sector.
 Below are charts for Citi group, Bank of America, JP Morgan, and XLF the S&P select spider etf for the financial sector.  All of these charts are exhibiting the same pattern.  This pattern is called a bear pennant.  A bear pennant occurs when the market trades within a downward channel and begins to make an attempt to rally.  This rally ultimately fails due to the inability of the price to make it through an overhead resistance level that has been tested and retested over and over again with smaller and smaller price movements.  After the final attempt this pattern breaks down indicating a much larger drop than the previous downward trend.  On every one of these charts we see the same pattern which broke down two trading days ago and has begun a further move down.


When we look at the chart for XLF on a weekly time frame we can see that we are currently trading within a “support zone” formed this time of year two years ago.  If we make it through the lower support level of this zone, we are more than likely going all the way back to the ’09 lows.  The below annotated chart is showing multiple signals that make me think this is going to be what happens.  Although the Di lines on the ADX are showing an attempt to converge, we are seeing a candlestick reversal pattern that failed to confirm, a bearish MACD, and a bearish stochastic alignment.

Do yourself a favor.  Do not buy into any financial market yet.  Wait for clear reversal signals and returned strength in the market.  I hope I have been helpful and will save you some money.  What’s the worst that can happen if I’m wrong?  If I’m wrong you have lost nothing.
                 

Friday, August 19, 2011

Play by play friday

5 Min:
                We started the day of with initial optimism bolstering an hour long rise which eventually formed a bearish rising wedge pattern.  We broke down out of this and formed a relatively narrow channel leading us farther and farther down.   Out of this channel we formed a flag pattern which ended up playing out as a bear flag pointing to farther downside pressure.  We began to level out around noon as American traders waited for European markets to close and settle forming a wedge or “coil” pattern (these require close attention to trade properly as they can break in either direction).  Towards the end of this coil we saw a bearish alignment of the 10,20, and 50 period moving averages indicating a breakdown of the pattern. 


                After the breakdown of the wedge pattern we fell into another bear channel falling somewhat steadily for the rest of the day.  However, at about 3:15 we attempted to break out of this bear channel and rally back up.  The attempted break out failed within the last 10 minutes of trading putting us down for the day with a poor outlook for Monday.
Daily:
                In the daily time frame we saw further broadening of the ADX, another downtick on the MACD histogram with the fast and slow lines failing to cross, and the stochastic moving even further down.  All of our indicators ended us in a bear channel leaving us down for the day.  From here I advise extreme caution.  We put in a potential reversal pattern in the form of another hammer closing very close to the 1120 support level.  From here we could confirm a short term reversal and rally once again, or we could not get confirmation and push below the 1120 area.  If we break below the 1120 area we may end up seeing capitulation and end much, much further down. 

Weekly:
                We closed out the week with conflicting data on our indicators.  The ADX and Di lines are currently trying to move to a bullish alignment (probably from the attempted rally).  The MACD histogram and stochastic moved even further into bear territory.   With one of the three indicators showing mixed signals we look to the moving averages and see that the 10 week moved below the 50 week with the 20 week not far behind.  With the lack of confirmation and multiple indicators pointing down you can probably expect to drop even more over next week ending near one of the support levels we formed last year.

Thursday, August 18, 2011

Markets decided

                Yesterday’s indecision was turned into decisive action in today’s markets as poor economic U.S. data and euro zone worries pushed us back down.  We started the day off with a massive selloff at the open and never really made an attempt to rally back.  This is eerily close to my daily chart from yesterday’s close. 

                We got confirmation of a hammer we formed two days ago today marking the end of this rally attempt.  The Di lines on the ADX are beginning to broaden once again hinting to further selling ahead.  Our MACD lines turned downward with the histogram putting in a downtick pointing towards a larger valley to carve out.  And the stochastic fast crossed over turning at the 50 line.  Everything, short term and long term are now bearish.  I didn’t think it would play out like this.

                After the initial selloff we began trading in a range between the 23% and the 50% Fibonacci retracement lines on the 15 minute chart.  Being below the 23% line I believe that we will go down at least to the 1130 level tomorrow.  Further on we will be watching levels of support, the closest of which is at the 1120 area.  If we move back down to the 1120 area (not unthinkable considering we had over a 50 point drop today) and manage to push through it you should start looking for capitulation to come into the market and possibly moving back to the 2009 lows.

Wednesday, August 17, 2011

Which way will we go George? Which way will we go?

Daily:
                Indecision is the word of the day.  We closed just below the 10 day moving average yet again.  We started out the day moving up before slamming into a former support level at 1215.  Immediately afterwards we started moving down and bounced off of the 1180 area for a rough trading range of 35 points on the S&P 500.  We eventually closed almost dead even indicating a degree of indecision in the markets. 

                The ADX is still doing the same thing it has been for the past week.  The Di- is still moving down, the Di+ is still moving up, and the ADX is trending sideways.  MACD is still moving to a cross with the histogram putting in another uptick.  However, the stochastic could end up rolling over at the 50 line and trend back down.
                We could still move higher but I think it will be short lived due to resistance at the 1230 level and the 20 day moving average which would form major resistance.  If we move up it may end here.  Watch the 1230 level closely for signs of reversal.  If we don’t move past 1215, we may move back down and challenge the 1180 period yet again.  If we break through the 1180 period I think that would be a good sign that the recent rally has failed.  If it moves through this level sit on your hands.  We won’t have a clear image of what to expect until we get through either the 1215 level or the 1120 level (I know, a 100 point swing).
60 min:
                I’m not very good at interpreting wedging/pennant patterns.  They are very difficult to get a clear signal out of because it depends on where you draw your trend lines as to what signal it gives you and the direction you get out of the trend depends on whether you break out or break down.  Simply put, we either have a bearish rising wedge which has the potential to break down and hurl us down to or through the 1180 level.  Or, we could have a bull pennant which would move us up.  If we move up we could see that 1230 or 1260 level (a vagueness rating of 30 points, I know and I’m sorry.  There just isn’t much that is clear out there right now).  I feel that I have fallen a little short today and would strongly suggest you check out Ron Walker’s site http://www.thechartpatterntrader.com/


Tuesday, August 16, 2011

Is it "Hammer Time"?

                Today’s movement was further evidence that the world markets have intermingled to a point where everything moves in lockstep.  We opened moving down and hit that 1180 area before making an attempt to advance back to the until the Merkozy press conference yielded information that the market didn’t like.  We were expecting some kind of euro bond but were left disappointed.  After that disappointment we headed straight back to the 1180 area and then started moving back up towards even.  At about 3:15 we set up a bull channel on the 15 min chart and have been following that so far.
                We had yet another hammer set up today on the daily chart indicating a potential reversal (all reversal patterns require confirmation).  Confirmation would occur if we close tomorrow below that 1180 low we put in today.  I don’t think this is very likely.  Although the Di + turned sideways, the MACD and stochastic remain bullish for the short term.  I expect that we will move back up after people have shrugged off the Murkozy info and head to about 1210-1220 tomorrow before moving closer to the 20 day moving average or the neckline.

                Today we also have the S&P 500 bullish percent chart for you.  This is a very good indicator of reversals and “contra” trends (contra trends are short term reversals).  It called the reversal from our head and shoulder pattern and is showing a short term contra trend today.  This remains in bullish direction for the moment.  I expect that we will advance on this before reversing back to the long term trend at around the 25-30 area.

Important Pre-Market Update

                I need to revise what I said yesterday about what to expect from the market today.  The best way to do that is to refer you to Ron Walkers public chart list and his video for yesterday’s market.  You can find this chart and others at   http://stockcharts.com/def/servlet/Favorites.CServlet?obj=ID1926808&cmd=show[s237471733]&disp=O  and his video for Monday August 15 at http://www.thechartpatterntrader.com/. 
                Basically we are going to see an extremely short term pullback from yesterdays close to the 1180 area before heading higher.  I believe that we are going to form what is called a head fake.  A head fake is where price pushes above a level of resistance, pulls back below it, and then pushes through it.  This is very common around moving averages.  I did not think this was going to happen but futures are implying that this is going to happen over the next couple of days.

                If you look at Mr. Walkers 60 min chart for yesterday he breaks down trend lines and other levels of resistance.  There is further explanation of these trends lines as well as other analysis that points to the 1180 area before we move higher.  The green marks on this chart are mine but the rest are  Ron’s.  I fully suggest that you visit his site http://www.thechartpatterntrader.com/ and help support his site as it is an excellent learning tool that I use daily in case I miss something like I did last night.

Monday, August 15, 2011

Du, Du, Du

                Finally got our confirmation today.  We rose from the start and after a short move down from the opening high we moved all the way up clearing multiple levels of resistance.  We cleared the previous highs of the candle pattern confirming a reversal as well as closing above the 10 moving average and the 1200 psychological level (psychological levels of resistance occur at zeros, 10, 20, 30, etc.). 
                The positive and negative di lines continue to converge with the advance decline line remains above the negative.  This indicates that there is likely still more upside to come and continues to be bullish for the moment.  The two di lines will probably touch and reverse when we reach the neck line.
                We had another uptick on the MACD histogram with the fast and slow lines moving closer to a cross.  When the histogram moves above the center line and the fast and slow lines cross, it is widely considered a short term bullish signal.  MACD is widely followed by many technical analysts as it is in “instep” indicator and tells you what is going on not necessarily what is going to happen but it can indicate shifts in momentum.
                The stochastic is moving more toward an uptrend than a cross and advancing towards the 50 line.  This indicates that momentum for the moment is positive.  This may be a little speculative with the volume drying up but the stochastic is usually a pretty good indicator of momentum.  Everything except the moving averages point to short term bullish at the moment.
                From here we can expect volume to pick up in the coming days with an advance to either the 20 day moving average or the neckline of our head and shoulders topping pattern (see my post for more information on head and shoulder patterns http://policonifi.blogspot.com/2011/08/where-it-was-where-it-is-where-its-gona.html ).  We may move past the 20 day and go all the way to the neckline as it is a stronger level of resistance (it has been tested 4 times already with no ability to get through it) but I would advise caution at the 20 day.  Often things will “bounce” off of or around their 10 and 20 day moving averages.  We saw this yesterday when we advanced out of the gate before smashing into overhead resistance at 1190 which was right below the 10 day.  I should note that the moving averages are still in a bearish alignment so this current uptrend will be short lived and the reversal will be harsh.  Watch the 20 day moving average and the 1250 level very closely as we advance and you will be ready for the reversal.


Who Doesn't pay Taxes

                I keep hearing that slightly more than half of the population doesn’t pay taxes.  This is mainly an argument made by republicans that the problem doesn’t lay with revenues (i.e. taxes) as in that we need to raise percentages, but that we should “lower rates and broaden the base”.  This argument sounds good, but let’s looks at who these people are and why they don’t pay taxes. 
                The majority of people who don’t pay taxes are simply, most of the time, the people who can’t afford to.  These are mostly people who make less than $20k/year.  For a family of four these are people below the poverty line.  Does this make the argument sound better?  It certainly does not.  As a moral nation how can we say that we are going to increase taxes on the bottom rung to get us out of a situation that our politicians put us in? 
                What about the top 1%?  A large number of them don’t pay taxes as well.  If you “broadened the base” and taxed those who can’t afford it, you would get less revenue (as a percentage of income) than you would if you raised taxes on the rich.  I think that a plan like this would only create social “unrest”.  Marginally I think it is a wash because there are more poor than rich and the numbers would probably even out.
                So what can rationally be done?   Most of the rich that do not pay taxes avoid them by taking advantage of certain tax loopholes that they hire people to find for them.  Just one of these loopholes is investing in municipal bonds as they are currently non-taxable under the current code.  That is just one of the many loopholes used to avoid taxes.  If you want to increase revenue and avoid the immoral, the best way to do that is to get rid of these loopholes. 
                The other side is that we have a spending problem.  I agree, we do have a spending problem but I disagree as to where the spending problem is.  It’s true that the largest part of government spending is on entitlements.  However, a very close second is “defense” spending.  The issue is, we have the pinnacle of weapon technology in the world.  Bottom line, if a gun works, why do you need a new one?  Your welcome to check my sources for this info at: http://economix.blogs.nytimes.com/2011/06/28/who-doesnt-pay-federal-income-taxes-legally/
               

Friday, August 12, 2011

hmmm

                Not quite there yet.  We started the day with a continuation of yesterday’s trend on even lighter volume.  We are getting sign after sign that things are getting ready to turn around.  Keep a close eye on what happens on Monday.  With things setting up the way they are, when we finally do get a rally it is going to be a big one. 
                We opened at the same level we closed at yesterday and immediately swung for the fences and slammed into the 10 day moving average before coming back down to close just above yesterdays close.  The positive DI line on the ADX indicator is beginning to turn out of oversold territory.  We also had another uptick on the MACD histogram.  These are all signs that things are about to turn around.  Not to mention the narrow range in which we traded today indicating that the buyers where not taken over by the sellers. 

                Pay special attention to the market on Monday.  Even with the positive signals we have gotten over the past two days we still ended up with a potential reversal candle (this time with downward potential) called an inverted hammer (this works the same as a regular hammer, see my post http://policonifi.blogspot.com/2011/08/when-fear-takes-over.html).  I still think that we are going to get a rally back up to the neckline or at very least up to the 20 day moving average.  Be very careful over the next few trading days people, we are walking on egg shells here.

Thursday, August 11, 2011

Go Baby, GO!

                Well well well, we had a relatively stable day of trade.  Right out of the gate the S&P 500 began advancing ending up 4.63% falling with in pennies of our confirmation level.  There are several things that leave me to believe that even though falling $0.50 below our confirmation level, we are now in a position for an advance. 
                Volume dried up significantly today.  This is usually a signal of a reversal.  It doesn’t always happen right at the turning point but is typically a good indication of a coming change in direction.  The ADX line crossed above the negative DI line.  This is an indication that the market has over taken declining issues.  The uptick on the MACD histogram is an indicator that momentum is beginning to shift towards bullish pattern.  And the stochastic is rolled over today as well.  I am less inclined to believe the stochastic because it has had a bad track record with me recently but when multiple indicators are in agreement, you can be relatively certain that there will be a change in direction.

                So where do we go from here?  I suspect that tomorrow we will make it above the 10 day EMA (exponential moving average) and mark the beginning of our move up.  Over the next week or so we will probably go to 1220 or 1250.  Keep in mind that 1250 is a stronger level of resistance (as our neckline that was tested several times as support) and will most likely see a reversal there.  1220 is also a relatively strong level of resistance (the level at which we got QE2), but not as strong as 1250.